
Data engineering services for pipelines and warehouses that feed reports and AI

Our data engineering services fix reports that lag and data too slow to query. One client, a global mobile software developer, got 6x faster queries.

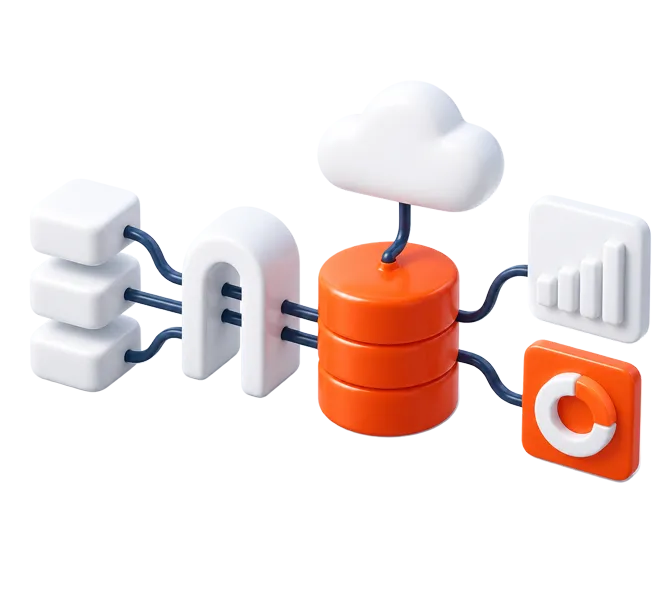
Illustration of data flowing from source systems through pipelines into a cloud data warehouse and dashboardsIllustration of data flowing from source systems through pipelines into a cloud data warehouse and dashboards

DATA ENGINEERING

When does a company need data engineering?

Usually when reports arrive late, the numbers differ between teams, or an AI project stalls because nobody trusts the data. Data engineering builds the pipelines that pull data from your apps and databases, the warehouse or lakehouse that holds it, and the models your reports read.

An assistant that answers from your data repeats whatever it reads, including the duplicate customer, last quarter's table and the field that means revenue in one system and bookings in another. When an AI pilot stalls after a good demo, this is usually where it got stuck. Fixing it takes shared definitions, pipelines that check what they load and a warehouse a model can query. Your reports need exactly that work, so AI becomes one more reader of the same data.

Who will direct the engineers day to day decides how you buy this. With a data lead and a backlog in place, add people from the data engineers and analysts you can hire, or bring in certified Snowflake and Databricks engineers. We present matched candidates within 7 days of your request, and our engineers and analysts average 7 years of experience. Without that person, engineers cost a lot and ship little, so hand us the project and accept it milestone by milestone. Our engagement models for data projects differ in who manages the work.

Diagram of raw data from apps, files and APIs being cleaned and modeled into tables ready for reports and AIDiagram of raw data from apps, files and APIs being cleaned and modeled into tables ready for reports and AI

WORKSTREAMS

Where your data problem lives

Find the symptom you recognize and follow it to the page that covers the work. Most projects touch two or three of these at once. A new warehouse needs pipelines to fill it, and a migration is the cheapest moment to fix the data model.

Data pipelines and ETL/ELT

Someone still exports a CSV every Monday. We replace that with batch and streaming loads from your apps, databases and APIs, run by Airflow, with Kafka carrying events.

Spark takes the heavy jobs, dbt the transforms and Python the custom code, which our Python developers write. Validation and monitoring are built in.

Architecture and modeling

Every team quotes its own revenue number. A data architecture engagement hands over target-state diagrams, a platform recommendation and a phased roadmap.

We use Kimball star schemas for BI and Data Vault where sources change often and history must stay auditable, and our data modeling comes with a data dictionary.

TECHNOLOGIES

The stack our data engineers work in

Amazon Redshift

Airflow

dbt

Fivetran

Snowflake

Databricks

Apache Spark

PySpark

Kafka

BigQuery

Synapse

Power BI

Tableau

AWS

Azure

Google Cloud

CASE STUDIES

Data problems we have already solved

External warehouse for a DAO contributor platform

A Web3 platform that evaluates DAO contributors made repeated third-party API calls, and they kept driving its costs up. We built an external warehouse that holds contributor data in one place, with easy access from the backend, on Python, Airflow, AWS Athena, dbt, S3 and AWS Glue Studio. Updates went from weekly to daily, and the client calls the total cost of ownership "virtually negligible". Read the DAO contributor platform case.

Analytics-ready data with Fivetran, dbt and Redshift

A professional education company's Redshift warehouse was waiting for pipelines to fill it. We studied its sources (Salesforce, Shopify, SAP), reporting needs and architecture, then chose Fivetran for ingestion and dbt to transform and model the data. The end-to-end pipelines we built carry validation and monitoring and feed Tableau dashboards. More in the professional education analytics case.

Trading data pulled 3x faster, with the API untouched

One API carried all the data a trading platform for crypto and tokenized assets used for analysis, and changing it wasn't an option. It returned few rows per request and capped how many requests it took. We left it as it was and built a Python wrapper library in front of the API, which splits a long period into pieces, sends them in parallel within the limit, retries a refused request and joins the answers into one data set.

A health app pipeline merging two data streams

Nobody knew whether a health app would get 10 users or a million, so the health app data pipeline we built is designed for both. Two data streams enter Pub/Sub, Apache Beam on Dataflow processes them, and the results go to BigQuery, Cloud SQL and Cloud Storage. In load testing, Dataflow started too many workers, so we capped them, and the BigQuery writes moved to batches. The app launched with about 100 users.

A bus company that prices against its competitors

A bus travel company wanted to see what carriers and ticket aggregators charge. Its pricing now draws on competitor bus ticket prices collected on a schedule, weekly at launch and daily later on. Aggregators come and go, so each source has its own workflow and a new one is added without touching the others. An interrupted request is retried. Our client reports 42% more bus tickets sold within four months of launch.

Shipment history plus the factors that move it

Python scripts on Kubernetes ran a logistics company's demand forecasting. They were unstable and did not scale. We replaced the scripts outright with a demand forecast rebuilt on Databricks and Azure, and brought seasonality, economic indicators and competitor data into it beside the shipment history. Our client's results were forecast accuracy up from 70% to 92%, 15% lower operating costs and 18% more on-time deliveries.

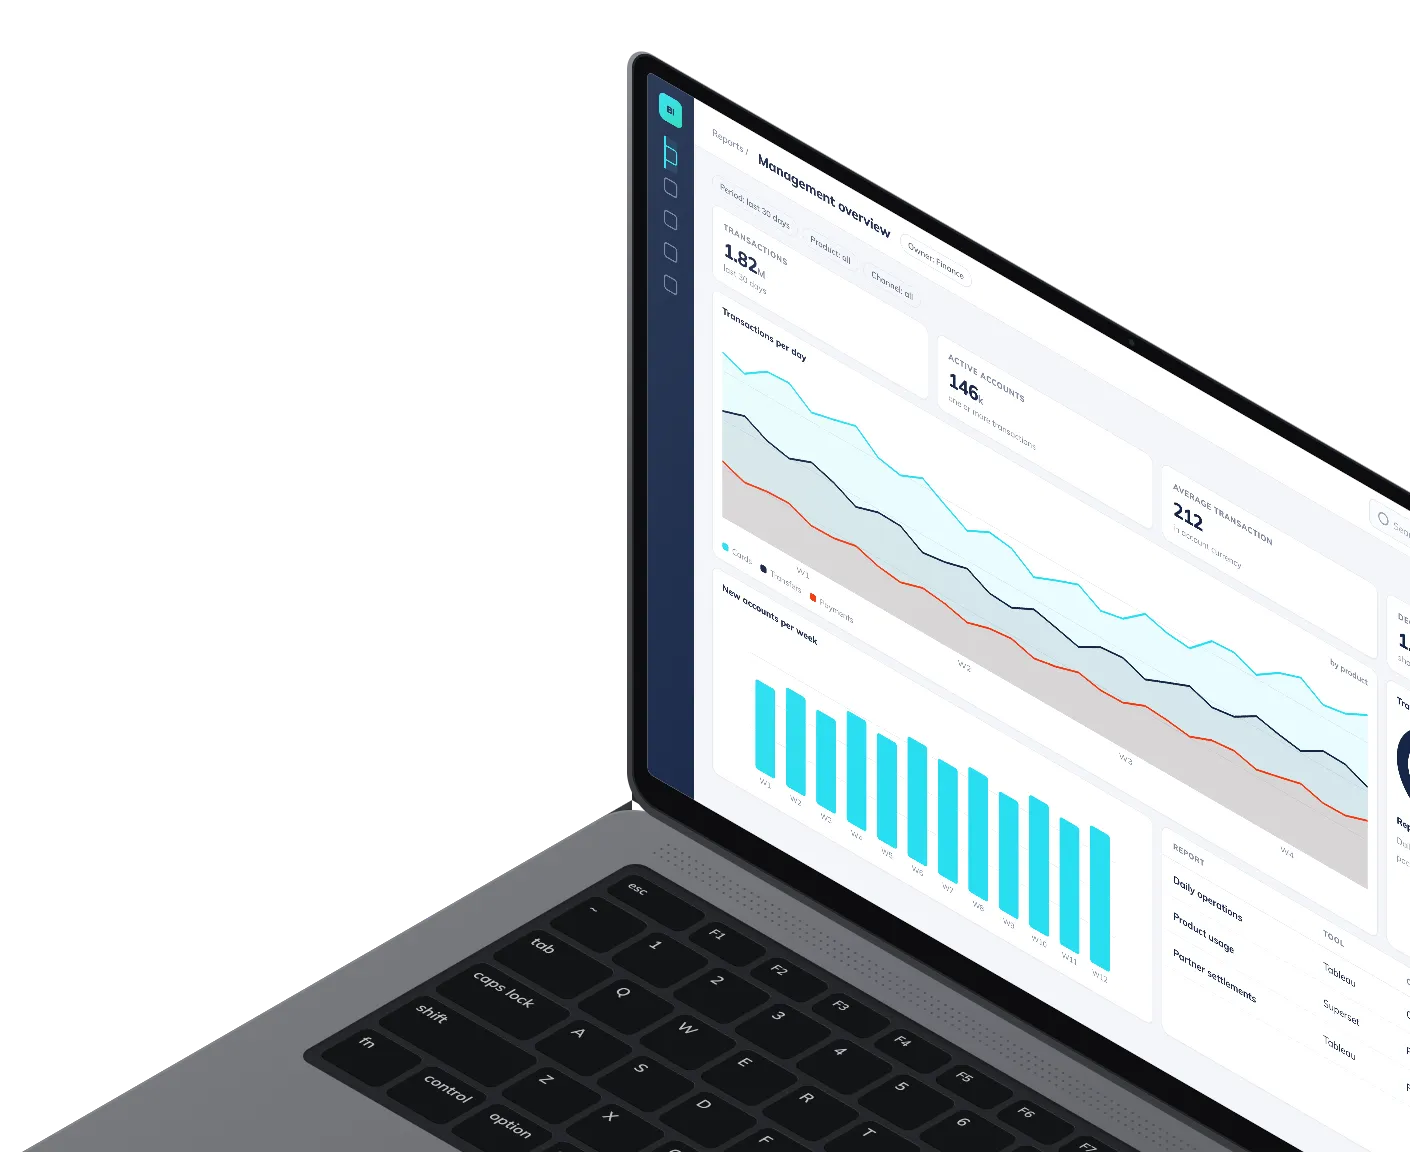
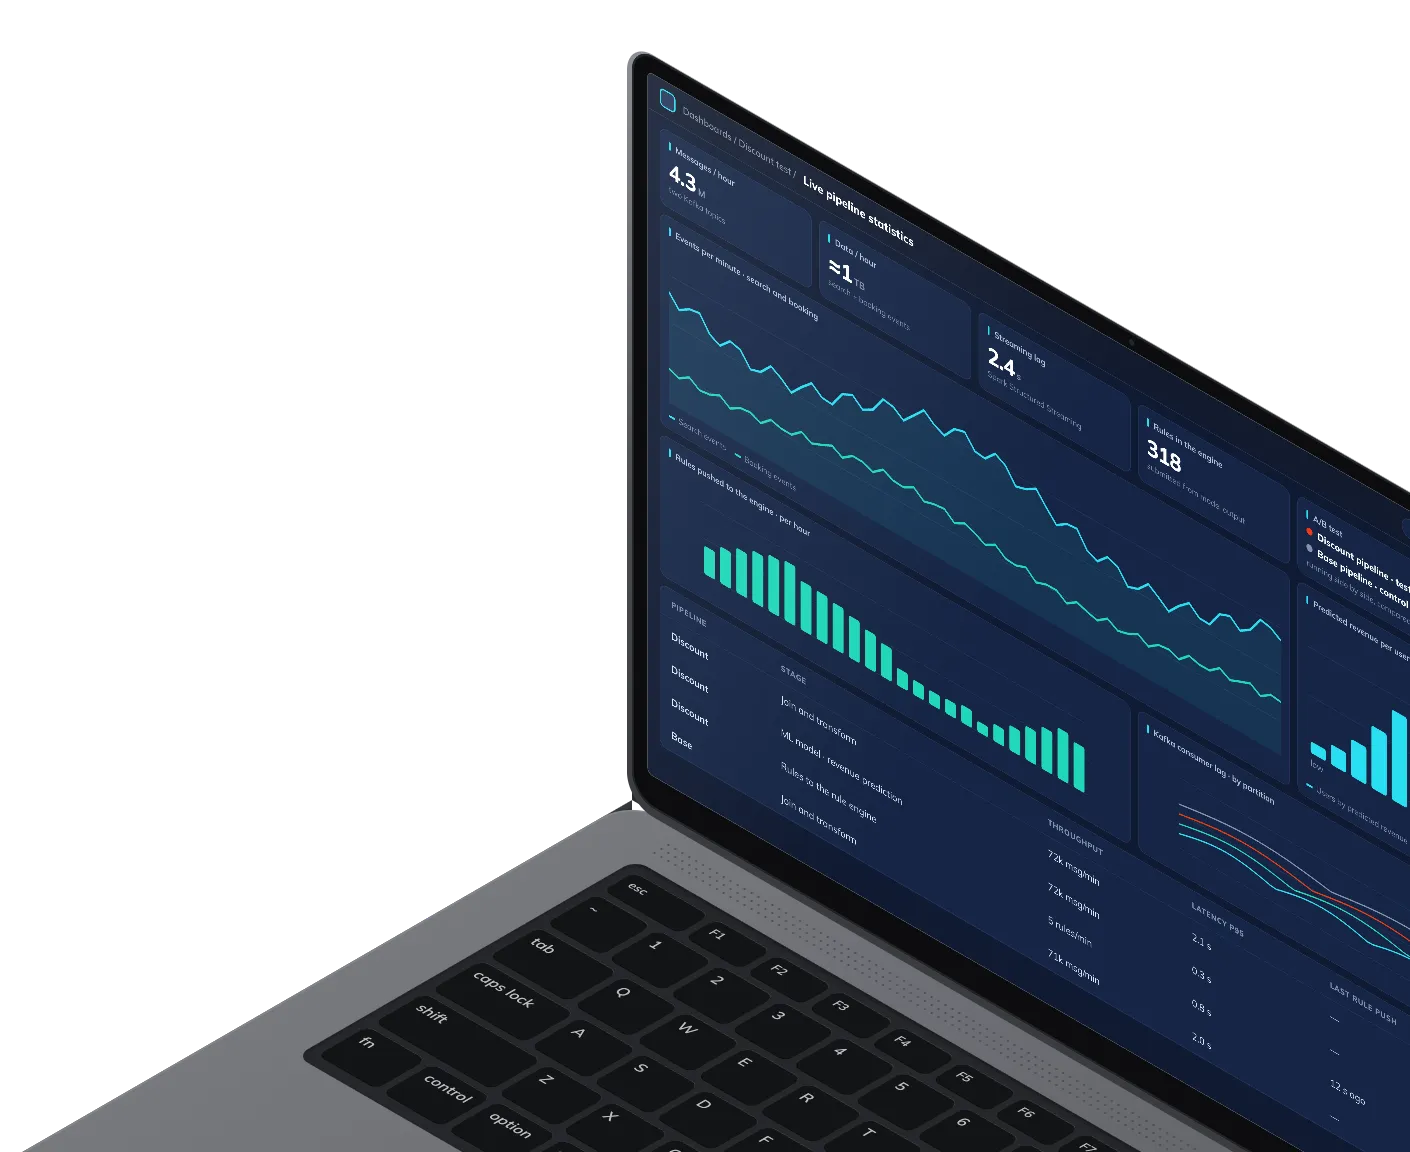
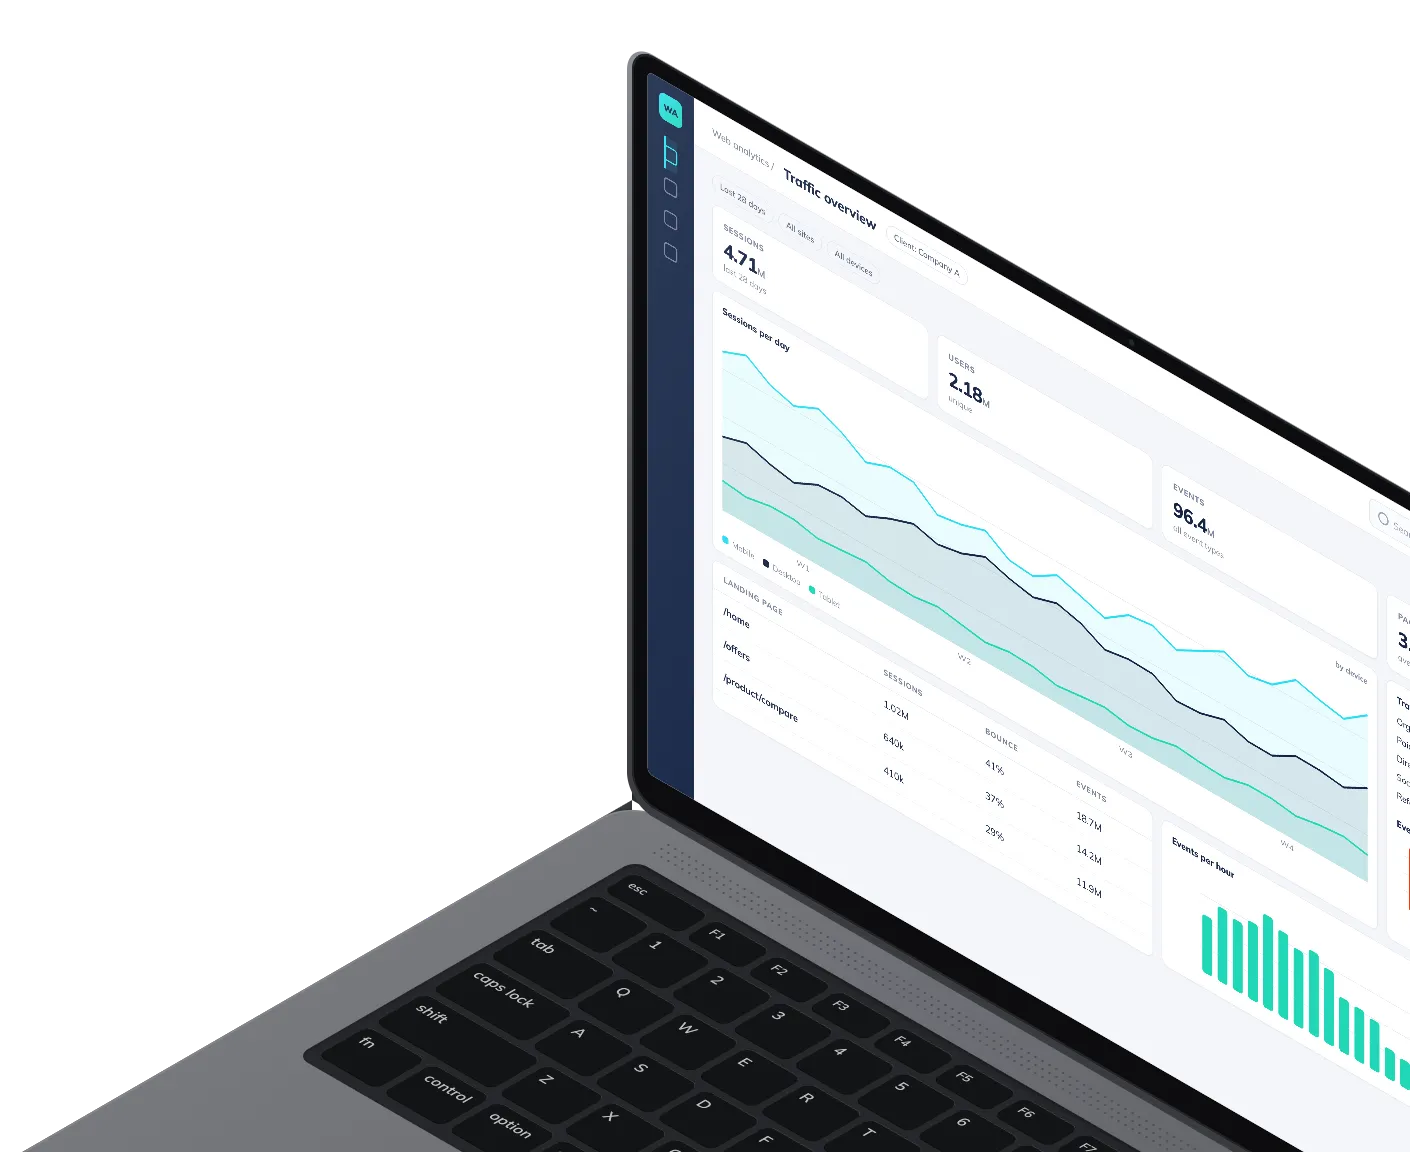
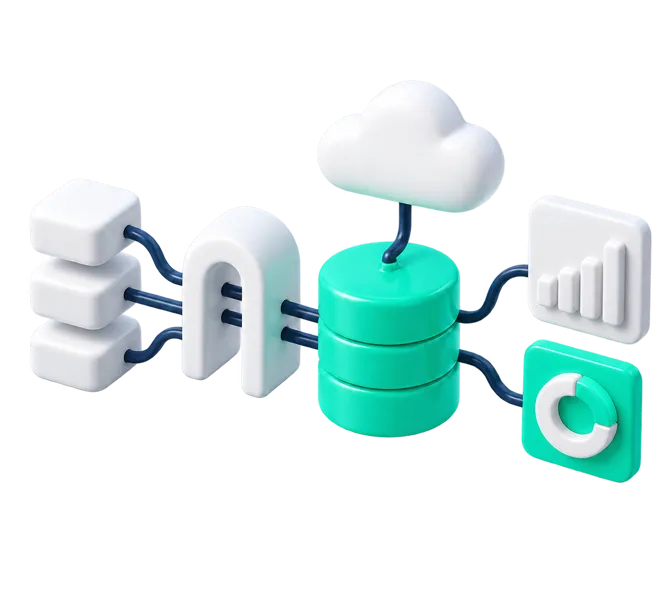
Illustrated dashboard of charts beside a data warehouse, for the data engineering case studies on this pageIllustrated dashboard of charts beside a data warehouse, for the data engineering case studies on this page

PROCESS

How a data project runs

Nobody writes a pipeline until we know who reads its output. The team works fully remotely, in Jira and Slack. CET/CEST is our default working day, and we shift the schedule to your hours, which for a US team can mean 4+ hours of daily overlap with the West Coast.

  1. STEP 1

    Discovery phase

    We map your sources, the reports and models that read them, and the current architecture, then hand over an estimate, a delivery plan and the risks we see.

  2. STEP 2

    Delivery in sprints

    Engineers build the pipelines, warehouse and models in sprints, and you see the data working at a demo every two weeks. Power BI numbers are tested against the source before each release.

  3. STEP 3

    Handover to your team

    We walk your team through each report and hand over the data dictionary behind it, plus the model diagrams where we built the model.

  4. STEP 4

    Support after launch

    Fixes, updates and small improvements by priority, for the pipelines and warehouse we built, or for ones another team built once we have audited them.

ENGAGEMENT MODELS

Engagement models and terms

Project delivery

We deliver an agreed scope end to end: plan, team, milestones, QA and release. You make the product decisions and accept each milestone.

Fixed price per milestone after discovery, or time and materials against an estimate.

  • Scope changes go through change requests.
  • On fixed-price projects, a warranty period agreed in the contract, usually 30–60 days.

Discovery phase

A short phase before a build: requirements and backlog, architecture, an estimate and a delivery plan.

Fixed price, usually 2–4 weeks.

  • The outputs stay with you whether or not the build continues with us.

Staff augmentation

Our engineers join your team and work in your process and tools. You manage them; we source, vet and contract them.

Hourly rate per engineer by role and seniority, invoiced monthly.

  • If an engineer isn't the right fit, we replace them within 14 days at no extra cost.
  • Knowledge transfer to the replacement engineer isn't billed.
  • There is no free trial period.
  • 30 days' notice to take an engineer off or end the engagement, with no minimum term beyond it.
  • Out-of-hours on-call only if agreed with you; we set its hours and billing together.
  • After two years, moving an engineer onto your own staff is something we can discuss.

Whichever model you choose

  • We reply to an inquiry from the contact form within 24 hours.
  • We sign an NDA before work starts, and IP passes to you on payment.

CLIENT RESULTS

Data work and what clients saw

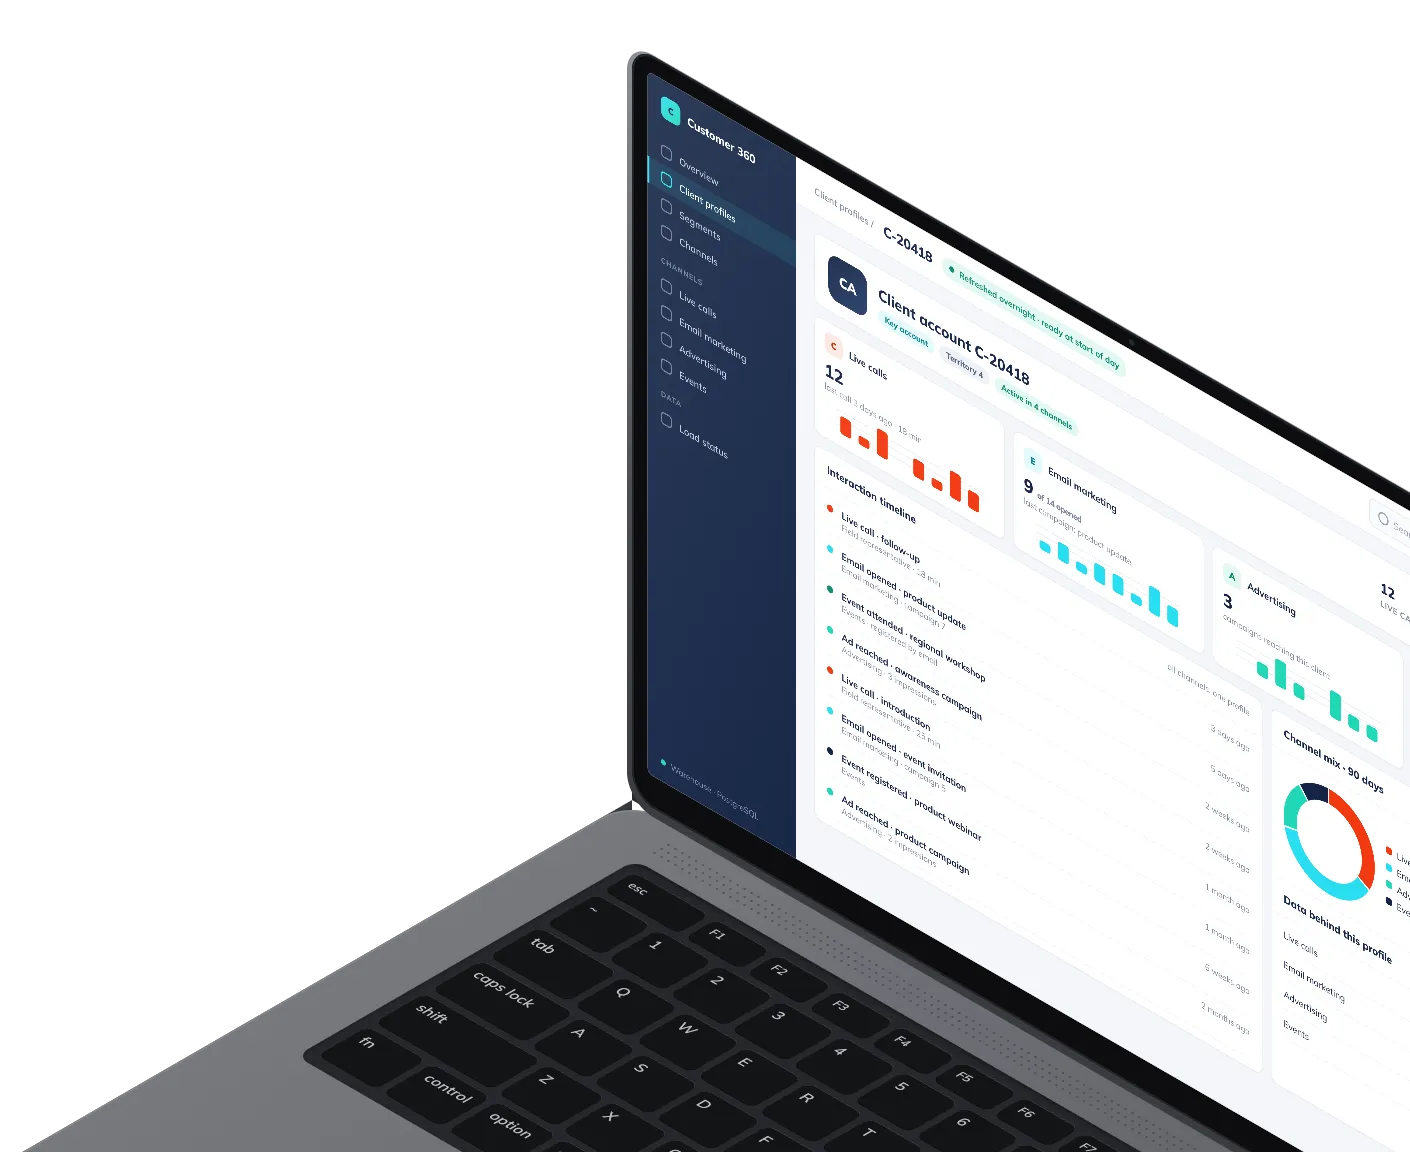
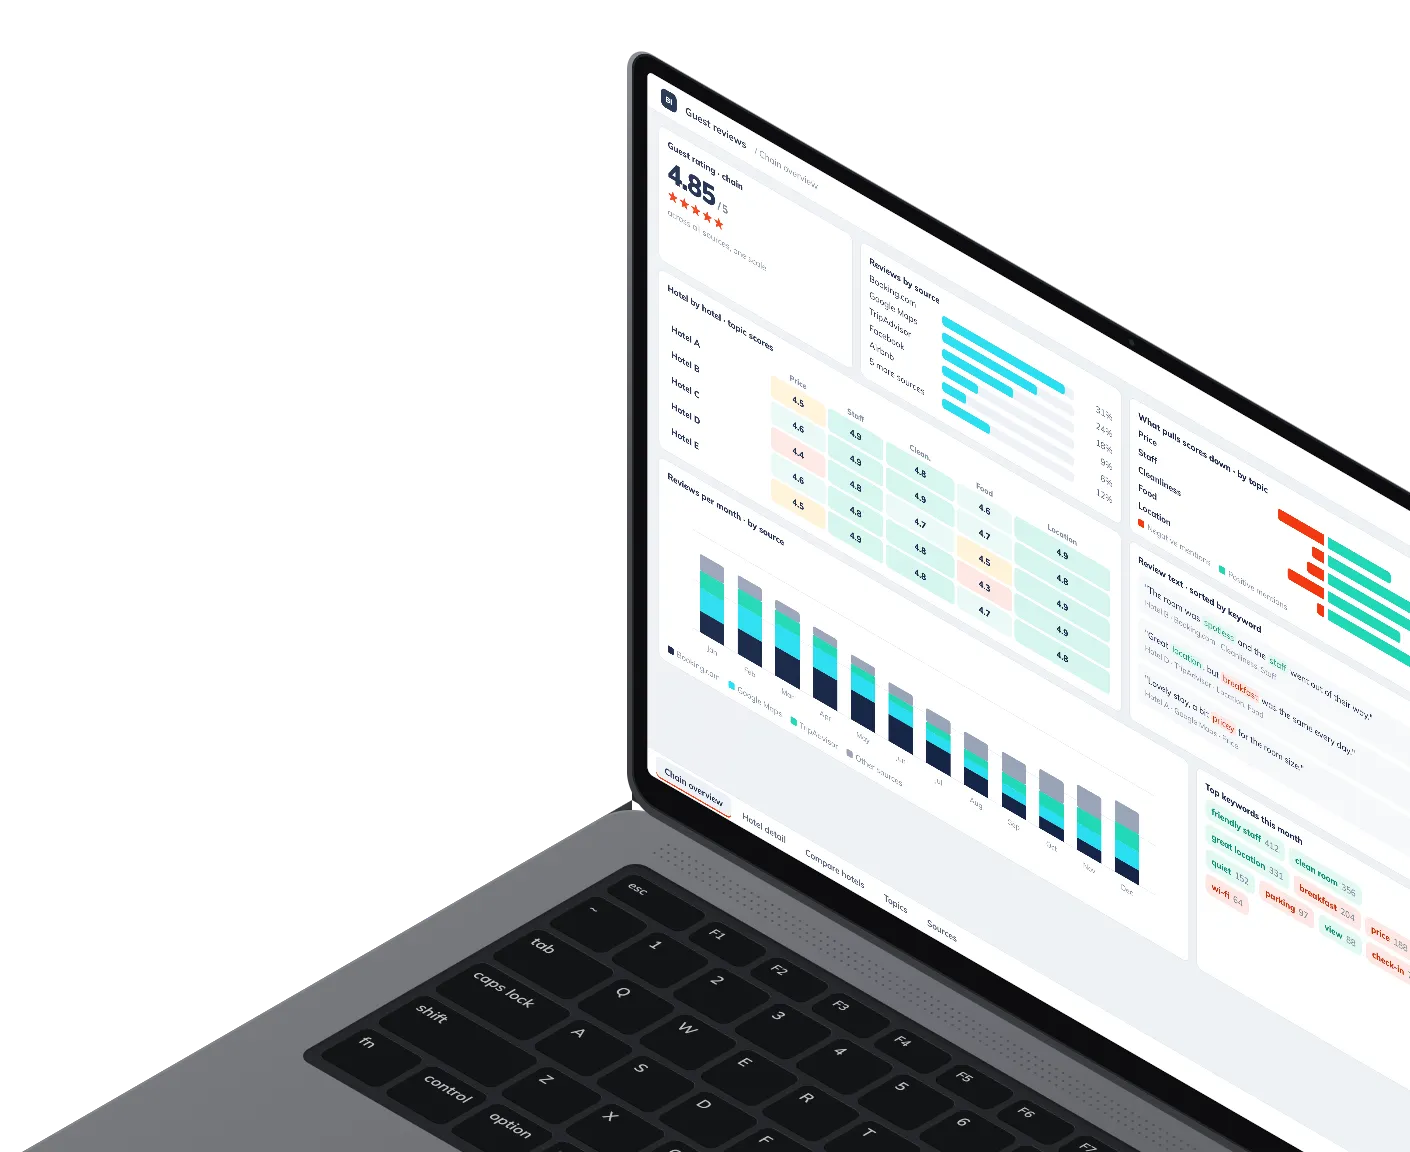
Judge a data project by a number the business already watches. Here that is the profit on one sales channel, a daily cloud bill, dashboards ready when people start work, and a hotel chain's guest rating, 4.40 before the launch and 4.85 after. The figures on these cards belong to their cases.

The surest test of a change is to run it beside what it replaces. The AdTech pipeline ran next to the old one while we compared their BigQuery tables, row counts included, and the travel discount pipeline ran beside the base one as an A/B test, which is where its profit figure comes from.

Tell us where your data gets stuck

Describe the sources, the reports that run late and what you want AI to read, and we will suggest a first step.

FAQ

What do buyers ask before a data project starts?

What moves the price of a data project?

In data work, scope tends to grow with the number of source systems, the state they are in and how many reports or models read the result. With engineers on your team, you pay an hourly rate per engineer by role and seniority, invoiced monthly, so headcount and seniority move the bill. A project runs at a fixed price per milestone after discovery, or as time and materials against an estimate, so scope moves it. The Engagement models and terms section on this page has the rest.

How does a data project start?

With a discovery phase. An architect, a business analyst and a delivery manager run it, and a lead engineer joins when the work calls for one. From you, we need access to the people who know the data and to the systems and documents that already exist.

Who owns the code and the data when the work ends?

You do. IP is yours once you have paid, and the code usually lives in your repositories, sometimes in ours. The data stays in the systems you run, and where we handle client data, a data processing agreement is part of the engagement. Handing everything back at the end is routine work for us.

What access do your engineers need to our systems?

Named accounts that you issue in your own identity system, one per engineer, with only the access the role needs to the warehouse, the cloud account and the source systems. All of it is removed when the engagement ends. Systems we control are hosted in the EU, and we work under GDPR as an EU company. Code and data in your own systems stay wherever you keep them.

Can we start with one workstream and widen it later?

Yes, and it is a sensible way to try us. One pipeline and the report it feeds will tell you more than a sales call. Clients move between models as the work changes: a discovery phase often leads into project delivery and then support.

Do we have to rebuild the warehouse to fix slow reports?

Often not. Find what is slow first: one heavy source, a transformation that recomputes everything every night, or a missing model that makes every report join raw tables. Each of those can be fixed where it is. A new platform makes sense when the current one can't hold your volumes or your team has already chosen another, and then the work becomes a migration planned in discovery.

How do you vet the engineers you place?

Every candidate goes through a technical skills assessment, a soft-skills evaluation and a check of their job history before reaching your shortlist. For a data engineer, the technical part covers SQL on large tables, data modeling and a pipeline design task. A Power BI candidate also gets a DAX and data-model task. Some roles add a live coding interview, and we run a background check when a client asks for one. Under staff augmentation, you interview candidates yourself before anyone starts.