Agreed KPI definitions
When the churn figure changes with the dashboard you open, the fault is in the definition. We settle each definition in writing with the teams that report the number.
Expect at least one metric whose definition nobody owns.


Our data analytics services start with the metric your teams count differently. 80%+ of our engineers and analysts are senior-level or above.


THE WORK
You get numbers your teams agree on, and the work that produces them. That means cleaning and modeling the data your business already collects, building the reports and dashboards people read on top of it, and adding forecasts where they pay off. It suits a CTO, a head of data or a founder.
The reporting end of the work, the dashboards people open every Monday, is what most teams call business intelligence. Put that end in order before you pay for forecasting. A forecast built on revenue that sales and finance count differently only predicts the next argument.
Analytics decides what is measured and how each answer reaches the person who acts on it. The pipelines and warehouse underneath are data engineering. Which side your gap sits on tells you whether to bring in an analyst who learns your business or an engineer who knows the platform.

SERVICES
A project or analysts can cover one layer or several. If you can list the reports you need, a project delivers them. If report requests pile up and nobody owns them, data analysts who join your team clear them under your lead.
When the churn figure changes with the dashboard you open, the fault is in the definition. We settle each definition in writing with the teams that report the number.
Expect at least one metric whose definition nobody owns.
Your sources load into the data warehouse behind the reports, with validation and monitoring built in. Expect the first loads to surface duplicate records.
Over it sits a data model built for reporting, the one place where "active customer" is defined and every report reads it from.


We build dashboards and reports in Power BI, or in Tableau if your team already works in it. We pick the tool with the people who will open the reports.
Before each release, the numbers are tested against the source system. Self-service filters go in where people want to slice the data themselves.


Predictive models such as demand forecasts or customer segments sit on the same data model as your reports. Our data scientists build them in Python or R.
After launch we watch each model for drift and check it against what actually happened, because buying habits and prices move.


TECHNOLOGIES
Power BI
Tableau
dbt
SQL
Python
R
Amazon Redshift
Fivetran
Apache Airflow
BigQuery
Snowflake
Databricks
Apache Spark
Azure Synapse
CASE STUDIES
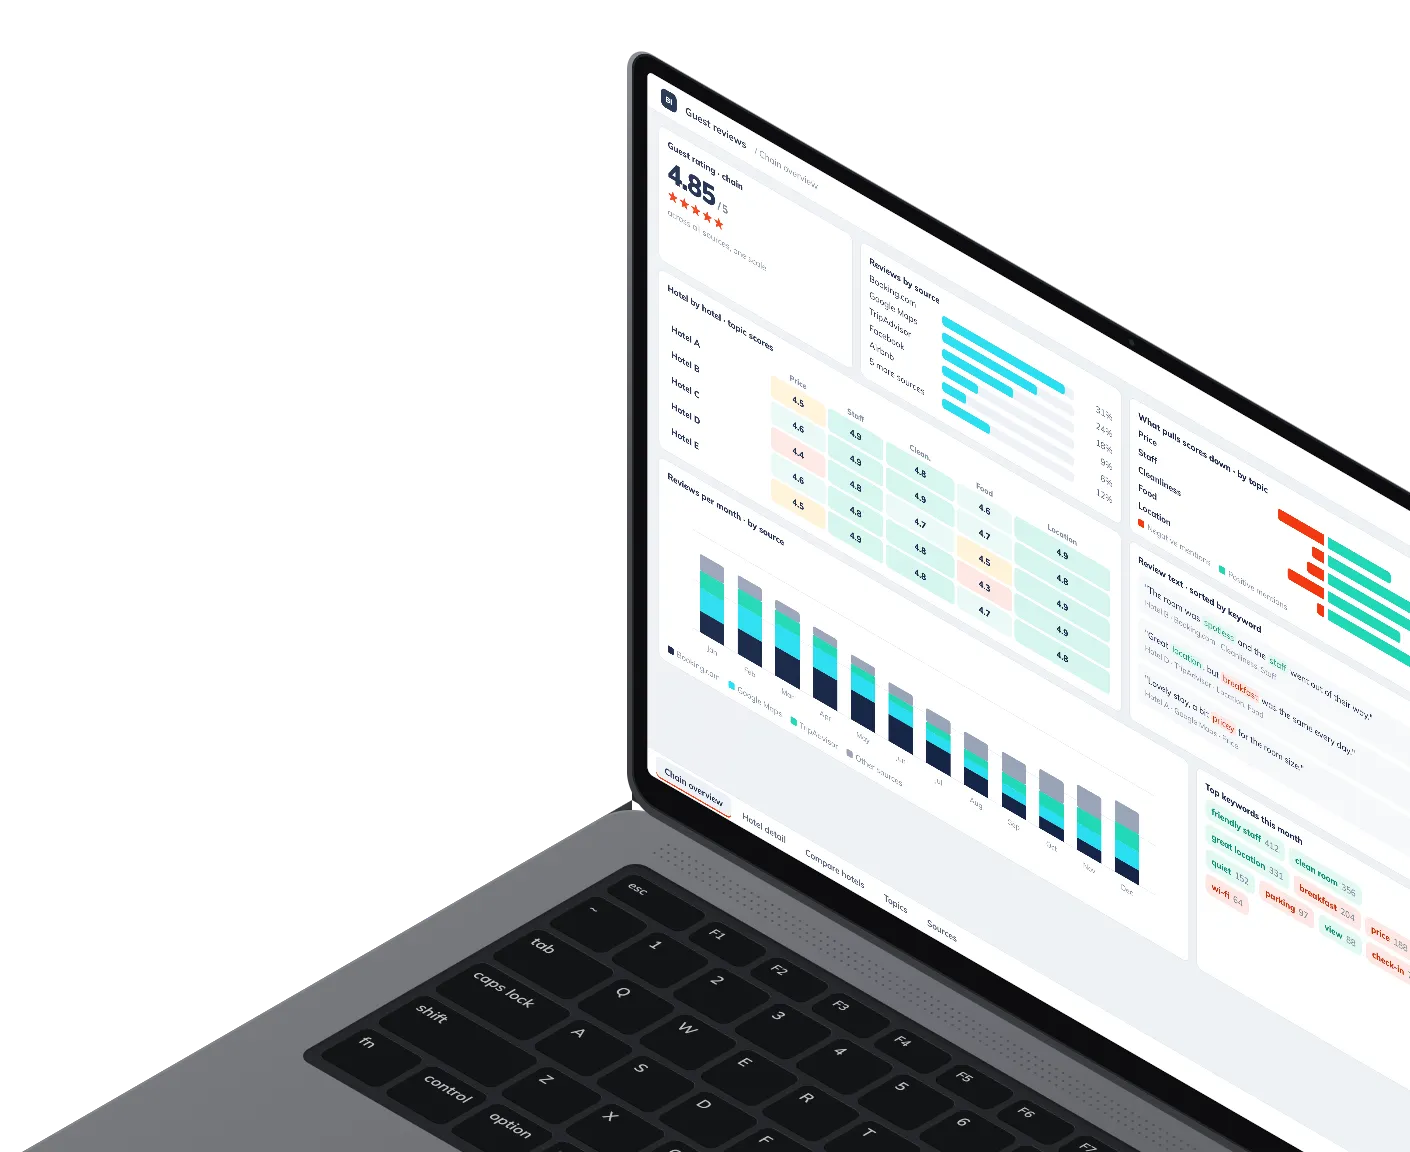
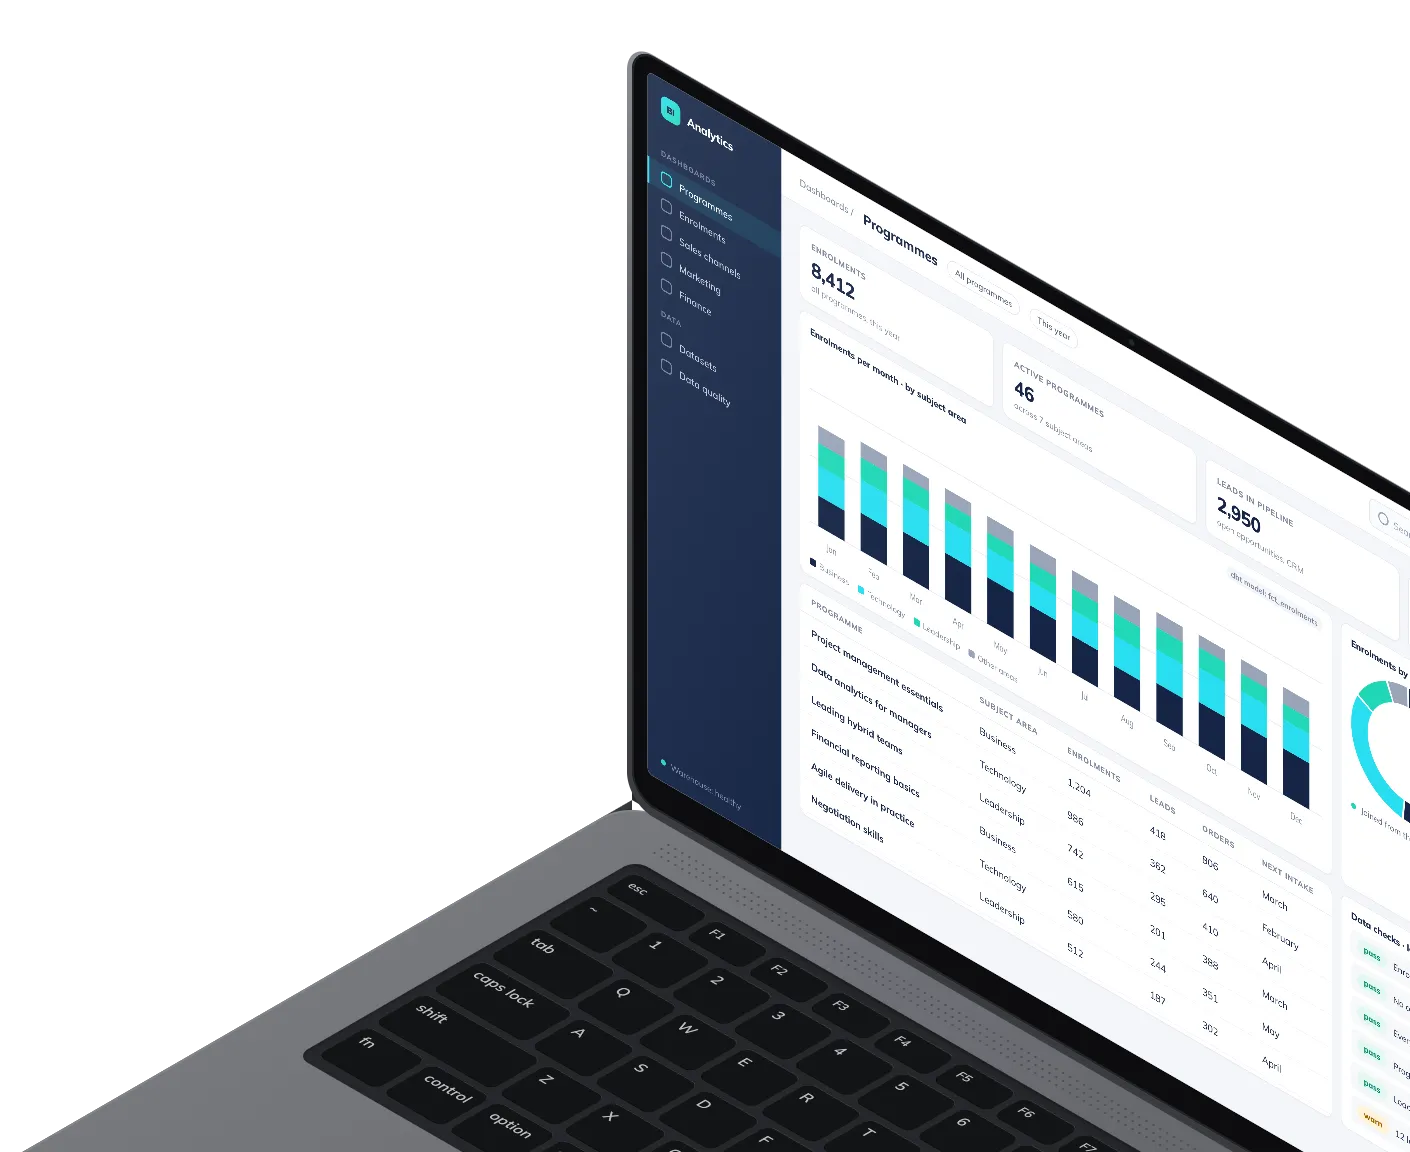
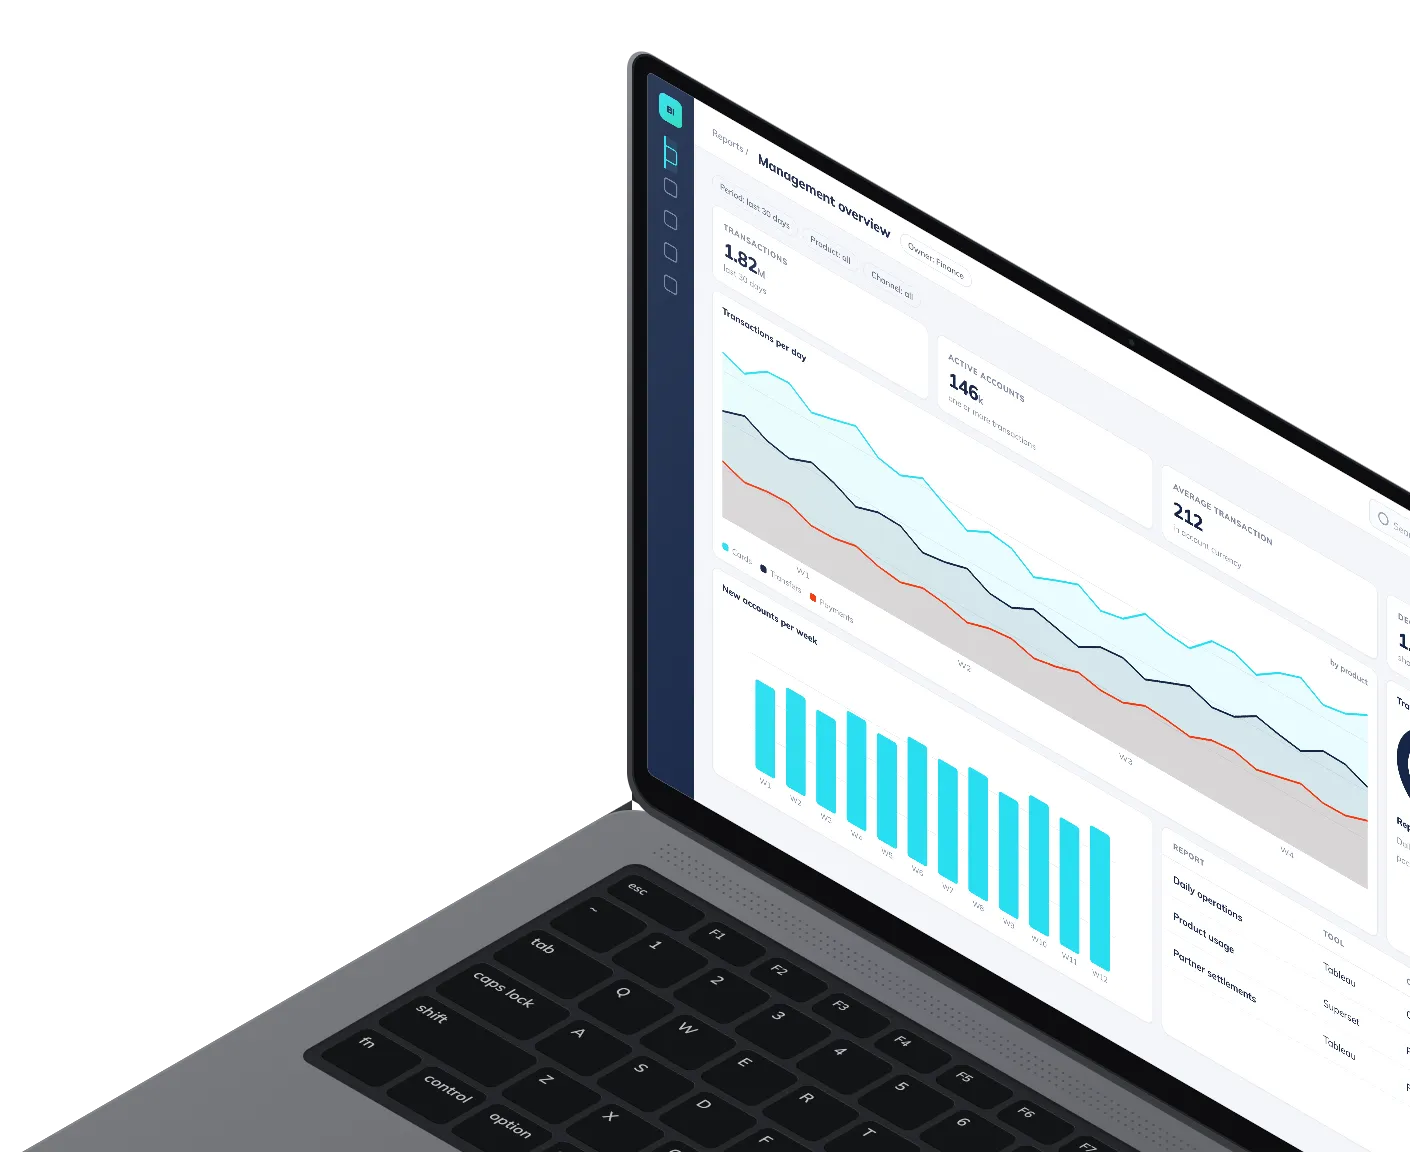
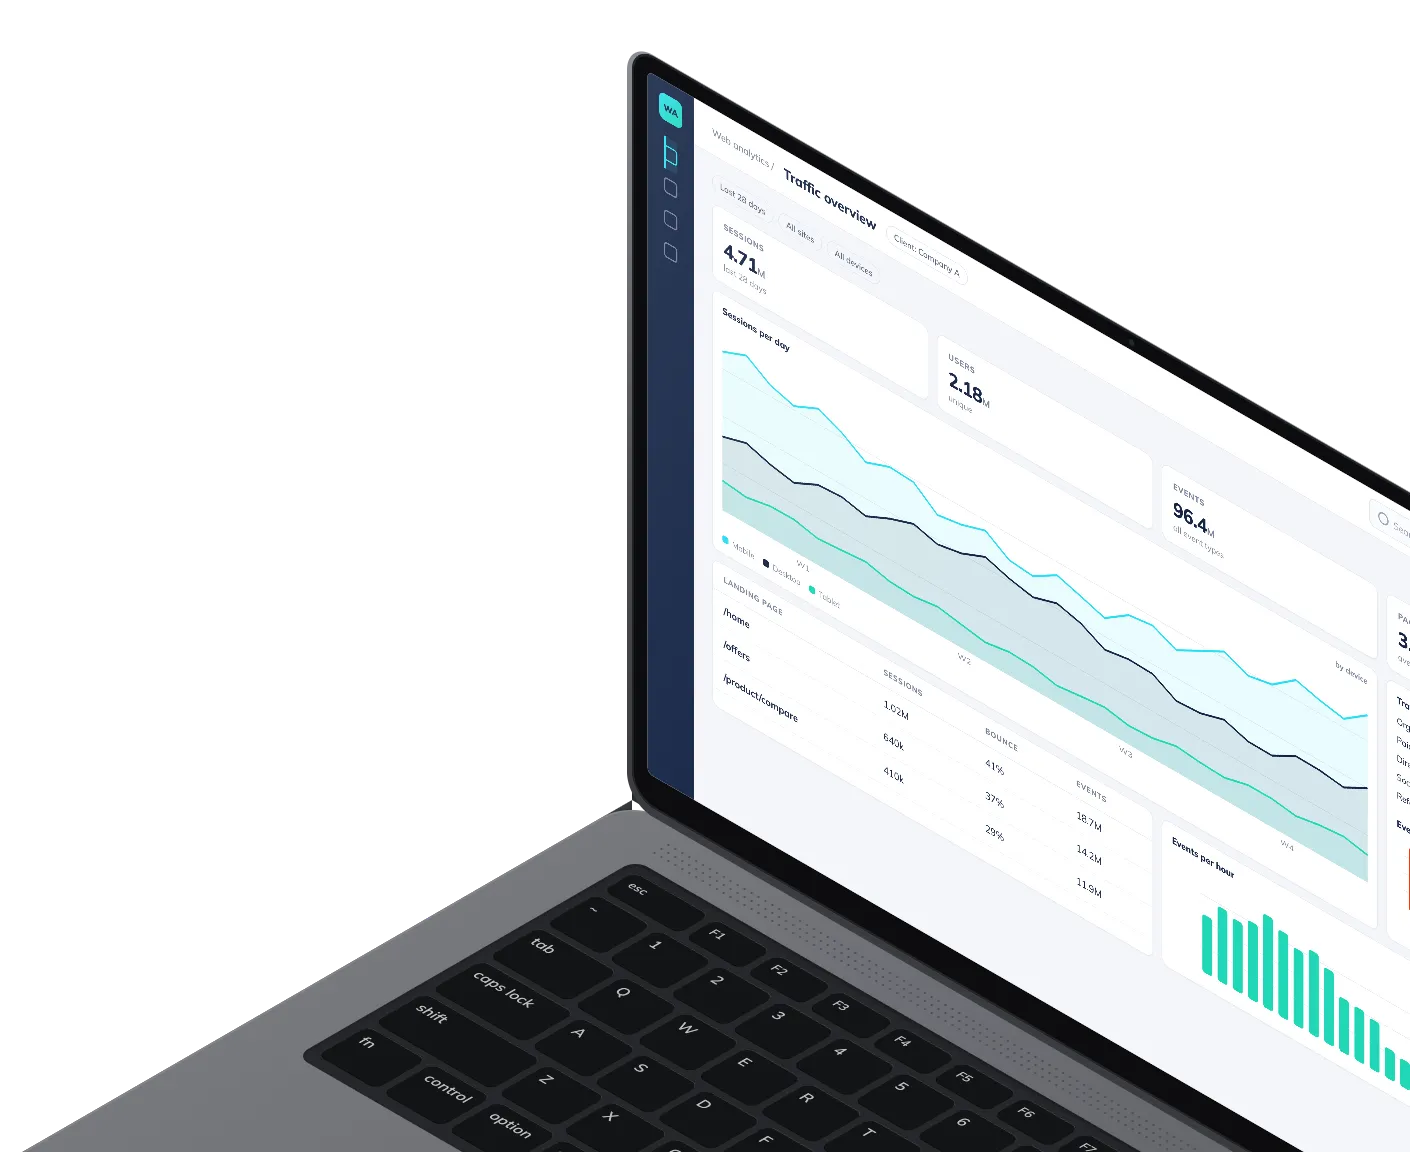
At the hotel chain, the education company, a fintech company and an AdTech company, the dashboards were the last layer, built on a data model.
PROCESS
Your data shapes the plan more than the brief does, so the first weeks go to reading your sources. Each later step ends in something you can check yourself, and after handover we can stay on under a support agreement, with response times agreed with you.

STEP 1
We analyze your data sources, reporting requirements and existing architecture, then agree the metrics and the tools. The written outputs are yours to keep.
2–4 weeks

STEP 2
We connect the sources, load them into a new warehouse or the one you have, and build the model every report will read from.

STEP 3
Reports are built in sprints, and a demo every two weeks shows them working on your data.

STEP 4
Your team takes over with a walkthrough of each report and the data dictionary behind it.
HOW WE WORK
We deliver an agreed scope end to end: plan, team, milestones, QA and release. You make the product decisions and accept each milestone.
Fixed price per milestone after discovery, or time and materials against an estimate.
Our engineers join your team and work in your process and tools. You manage them; we source, vet and contract them.
Hourly rate per engineer by role and seniority, invoiced monthly.

"A dashboard nobody opens is the most expensive report you own. We settle the question each report has to answer before we build it."

Dzmitry Kuchynski, Chief Operating Officer, Octalance
FAQ
The assumptions behind the quote. The number of sources and how clean they are, batch or real-time loading, what you already have and whether forecasting is in scope all move it more than the count of dashboards. A low quote often assumes cleaner data than you have, so compare quotes on the same assumptions. Power BI and Fabric licenses are bought from Microsoft and sit outside our fee. After discovery, the work runs at a fixed price per milestone or as time and materials against an estimate, as set out under Engagement models and terms.
Yes. Discovery is sold on its own, at a fixed price, and ends in written requirements, an architecture, an estimate and a delivery plan, which stay yours whether or not the build continues with us. Our side of the table is an architect, a business analyst and a delivery manager, with a lead engineer when the build needs one. From your side, bring whoever produces each figure and whoever signs it off.
We work through named accounts you issue in your own systems, with only the access each role needs, and that access is removed when the engagement ends. A data processing agreement is part of the engagement, and we work under GDPR as an EU company. Systems we control are hosted in the EU. Data in your own warehouse and cloud stays wherever you keep it.
Yes. The analyst joins your team, works full-time for you only and takes direction from you. You interview candidates before anyone starts and can turn any of them down. We present matched candidates within 7 days of your request. It can happen sooner, but that isn't guaranteed.
With one source and a handful of reports, no. A modeled layer over that source can carry them. Once several systems feed the same reports, count the hours someone spends each month joining exports by hand. Past a point, those hours cost more than a warehouse with one model on top.
For a first look at a small file, it helps. It can describe the columns and suggest a chart. A report your managers rely on every month needs a modeled source, access control and definitions someone has signed off, or nobody can say where a figure came from. Our engineers use AI tools where you approve them, and nothing of yours goes to a tool you haven't allowed.
Ask what you would do differently if the forecast were right. If nobody can name the decision, a sound descriptive report is the better buy for now. Before a build we agree a test set with you and the bar the model must clear to go live, and discovery tells you when a model isn't the right answer.