Travel
Real-time discount pipeline where A/B testing showed 32% more ticketing profit
Our client saw 17% more returning customers from its discount strategy over the 6-month test
Real-time data streaming
6 months
Who we worked with
Travel company with a discount to test
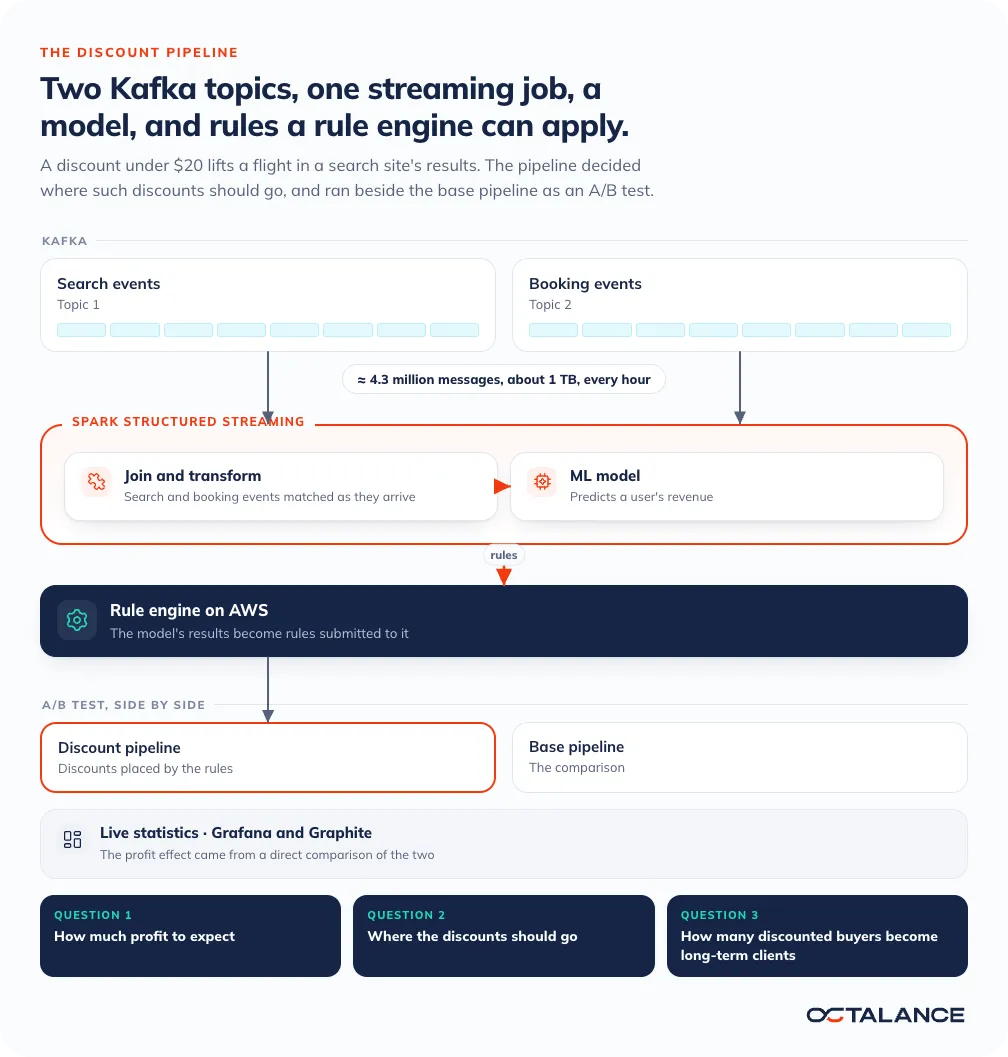
Our client is a travel company that wanted to test a new discount system. A small discount on a flight, under $20, lifts its offer in a flight search site's results. That costs profit on the ticket, but the same buyer might also take insurance, a car or a hotel. Three questions decided whether it was worth doing: how much profit to expect, where the discounts should go, and how many discounted buyers would become long-term clients.
What we did
From two Kafka topics to discount rules
Real-time streaming at about 1 TB an hour
Two Apache Kafka topics on Amazon MSK carry search and booking events, about 4.3 million messages an hour. Spark Structured Streaming on Amazon EMR joins and transforms that data as it arrives, and our CI/CD ships each change to the data pipeline. A discount meant to lift an offer in search results is only as good as the data behind it, and day-old data describes yesterday's buyers.
An ML model that predicts each user's revenue
Inside the stream, the pipeline applies an ML model we built to predict a user's revenue. A discount pays only when the buyer is worth more than the profit it gives up on the ticket, so a revenue prediction is the number the discount rules can use.
Results that become rules on AWS
The model's results become rules for where a discount under $20 goes, and the rules are submitted to a rule engine on AWS. A rule engine keeps the discount policy apart from the streaming code, which makes the policy easier to read and to change.
How the profit was measured
Two pipelines side by side, on one dashboard
A discount's profit is hard to forecast, because it depends on what the buyer does after the ticket. So the discount pipeline ran beside the base one as an A/B test, and the profit effect came from a direct comparison between the two.
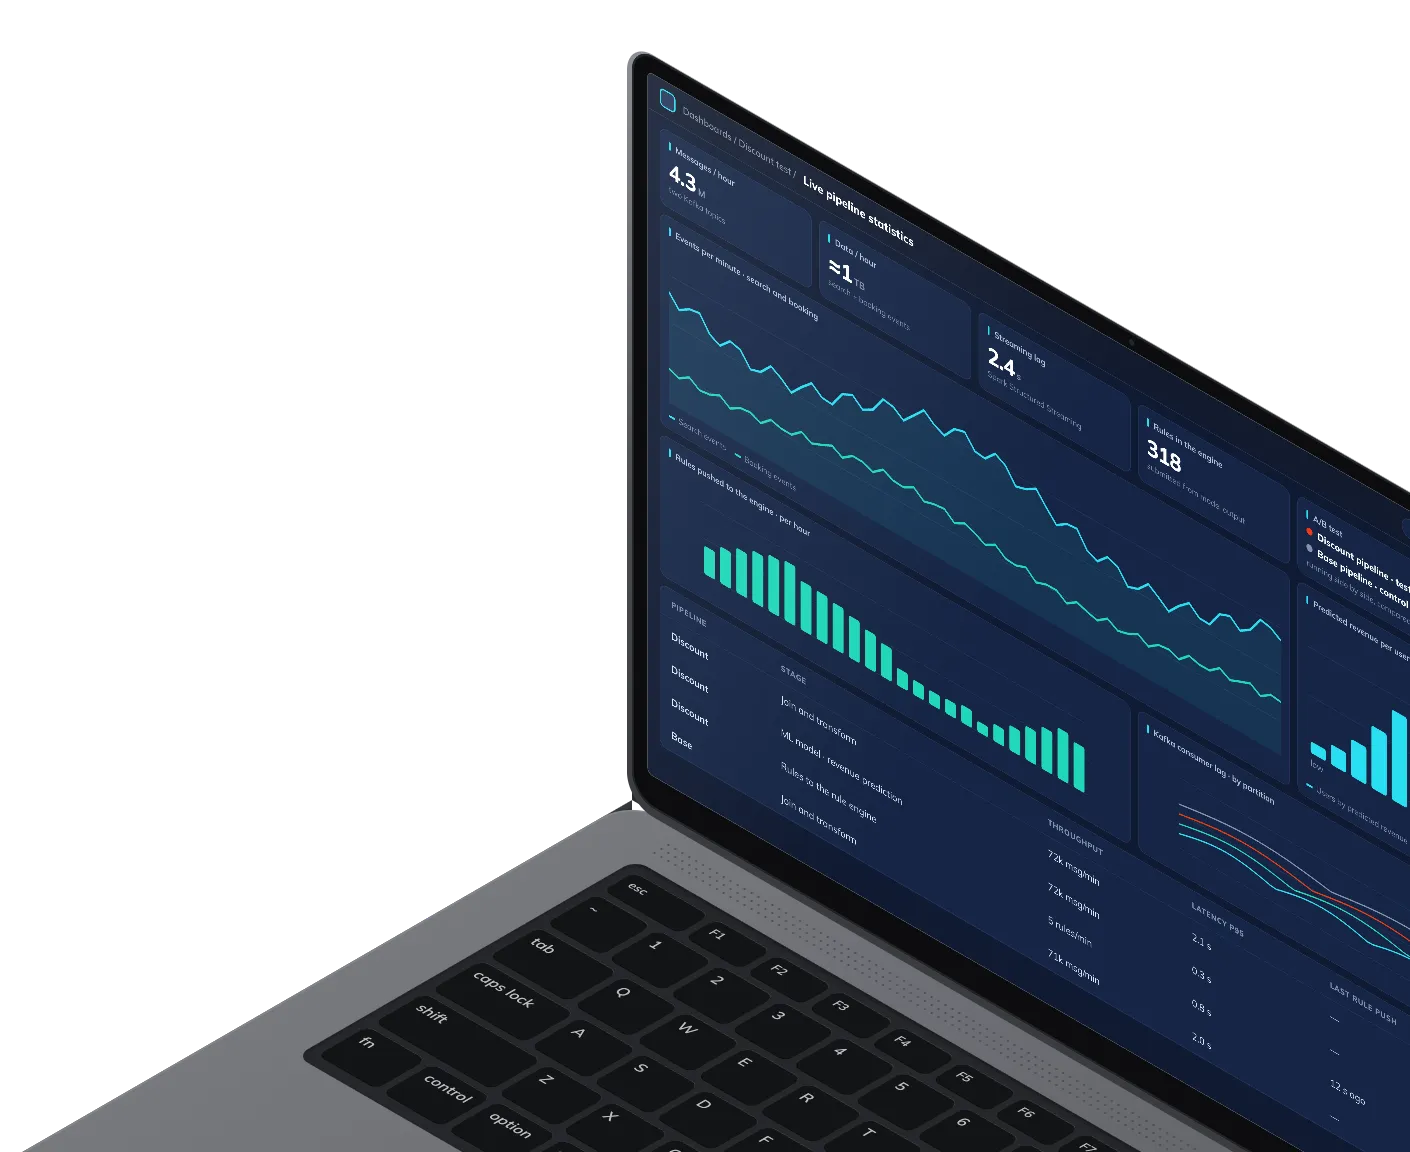
Live statistics from both sides went to a Grafana and Graphite dashboard.
The test ran for 6 months, long enough to count the discounted buyers who came back as well as the ticketing profit on that channel.
Our client's test in numbers
32%
More ticketing profit on that channel
17%
More returning customers from discounts
Want to test an idea on live data?
Tell us what you want to measure, where the data comes from and how fast it arrives. We answer within 24 hours.

Case studies